
How to Fix Google Ads Quality Score
Introduction
Low Quality Score is one of those problems that quietly drains budget for weeks before anyone notices. CPCs creep up, impression share drops, and the campaign looks like it's just "getting more competitive" — when the real issue is that Google is charging more because it trusts the ads less.
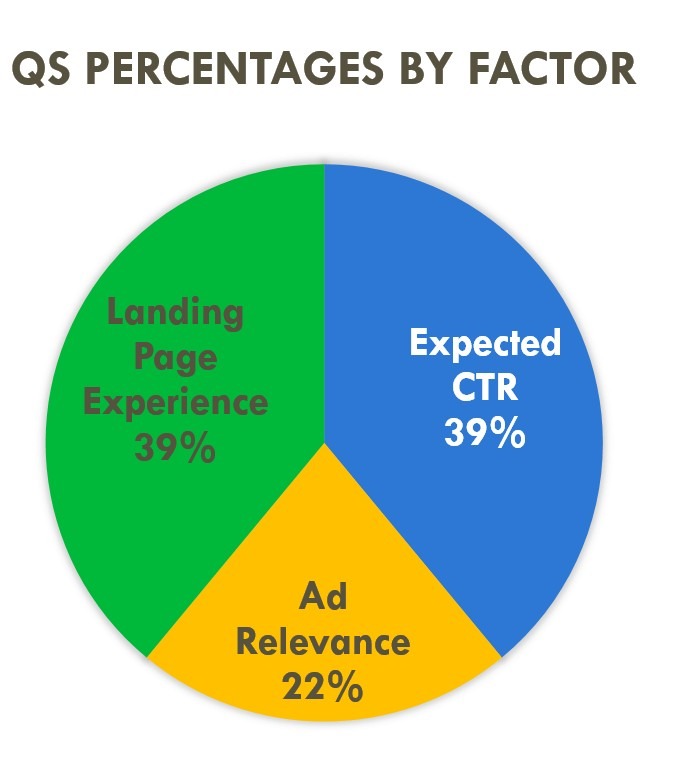
Understanding what affects quality score in Google Ads is the starting point. The fix isn't a single setting — it's a diagnostic process that works through three components: Expected CTR, Ad Relevance, and Landing Page Experience. Each one has different causes and different timelines for improvement.
This guide walks through how to fix Google Ads Quality Score systematically — from reading the diagnostics correctly to making changes that actually move the number.
What is Quality Score in Google Ads
Quality Score is a 1–10 diagnostic rating Google assigns to each keyword. It reflects how relevant and useful Google considers your ad and landing page to be for someone searching that keyword. A score of 7+ is generally considered healthy. Below 5, you're actively paying a premium on every click.
The important thing to understand: Quality Score is a diagnostic tool, not a bidding input. Google is explicit about this — the score itself doesn't enter the auction. What enters the auction is Ad Rank, which is calculated separately using similar but not identical signals.
Where to Find It in the Google Ads UI
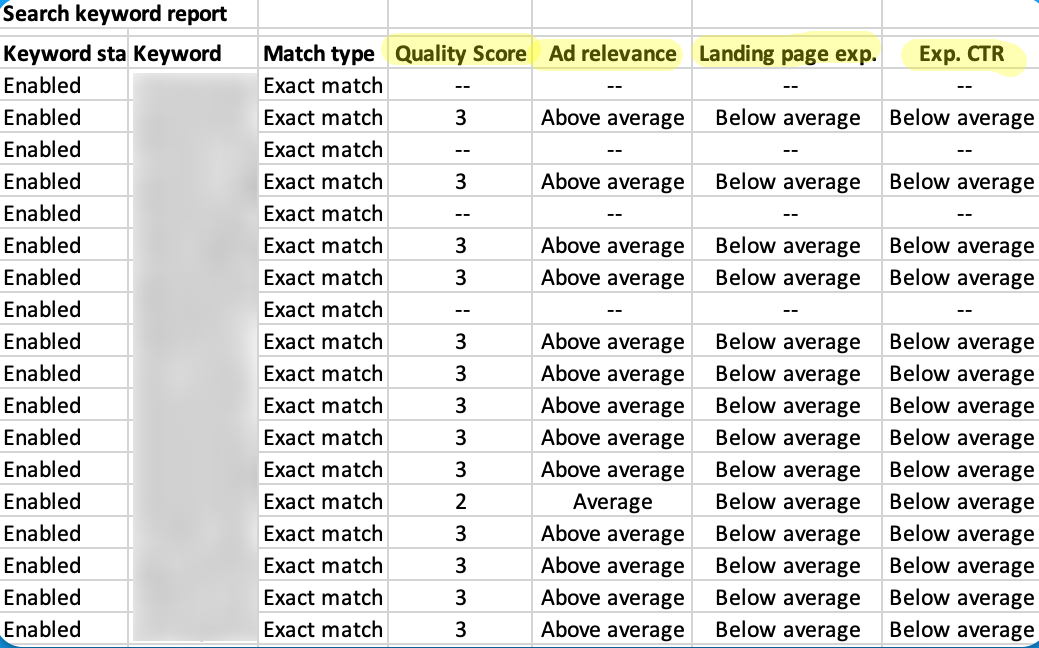
Quality Score lives at the keyword level. In the Google Ads interface, go to Keywords → Columns → Modify columns → Quality Score. Add the main Quality Score column plus the three diagnostic sub-columns: Expected CTR status, Ad Relevance status, and Landing Page Experience status. Each sub-column shows "Above average," "Average," or "Below average" — and these three ratings are where the actual quality score diagnostics work begins.
One thing worth knowing: Quality Score only shows for keywords with sufficient impression history. New keywords, low-volume keywords, and exact match keywords with limited traffic will often show a dash rather than a number — which creates its own diagnostic challenge covered later in this guide.
What You Will Fix in This Guide
The goal isn't to chase a 10/10 on every keyword. It's to identify which keywords are dragging performance, understand which of the three components is causing the problem, and make targeted fixes that improve quality score in Google Ads without wasting time on keywords that don't move the needle.
How Google Ads Quality Score Works
Quality Score and Ad Rank
The relationship between quality score vs ad rank Google Ads is one of the most misunderstood mechanics in the platform. Ad Rank is calculated as: Max CPC bid × Quality Score equivalent × Expected impact of ad assets. The "Quality Score equivalent" used in the auction is not the 1–10 number you see in the interface — it's a real-time calculation that happens at each auction and considers the specific user, device, location, and search context.
The 1–10 score is an aggregated snapshot. It's useful for spotting trends and identifying weak spots, but the actual CPC discount or premium is determined in real time.
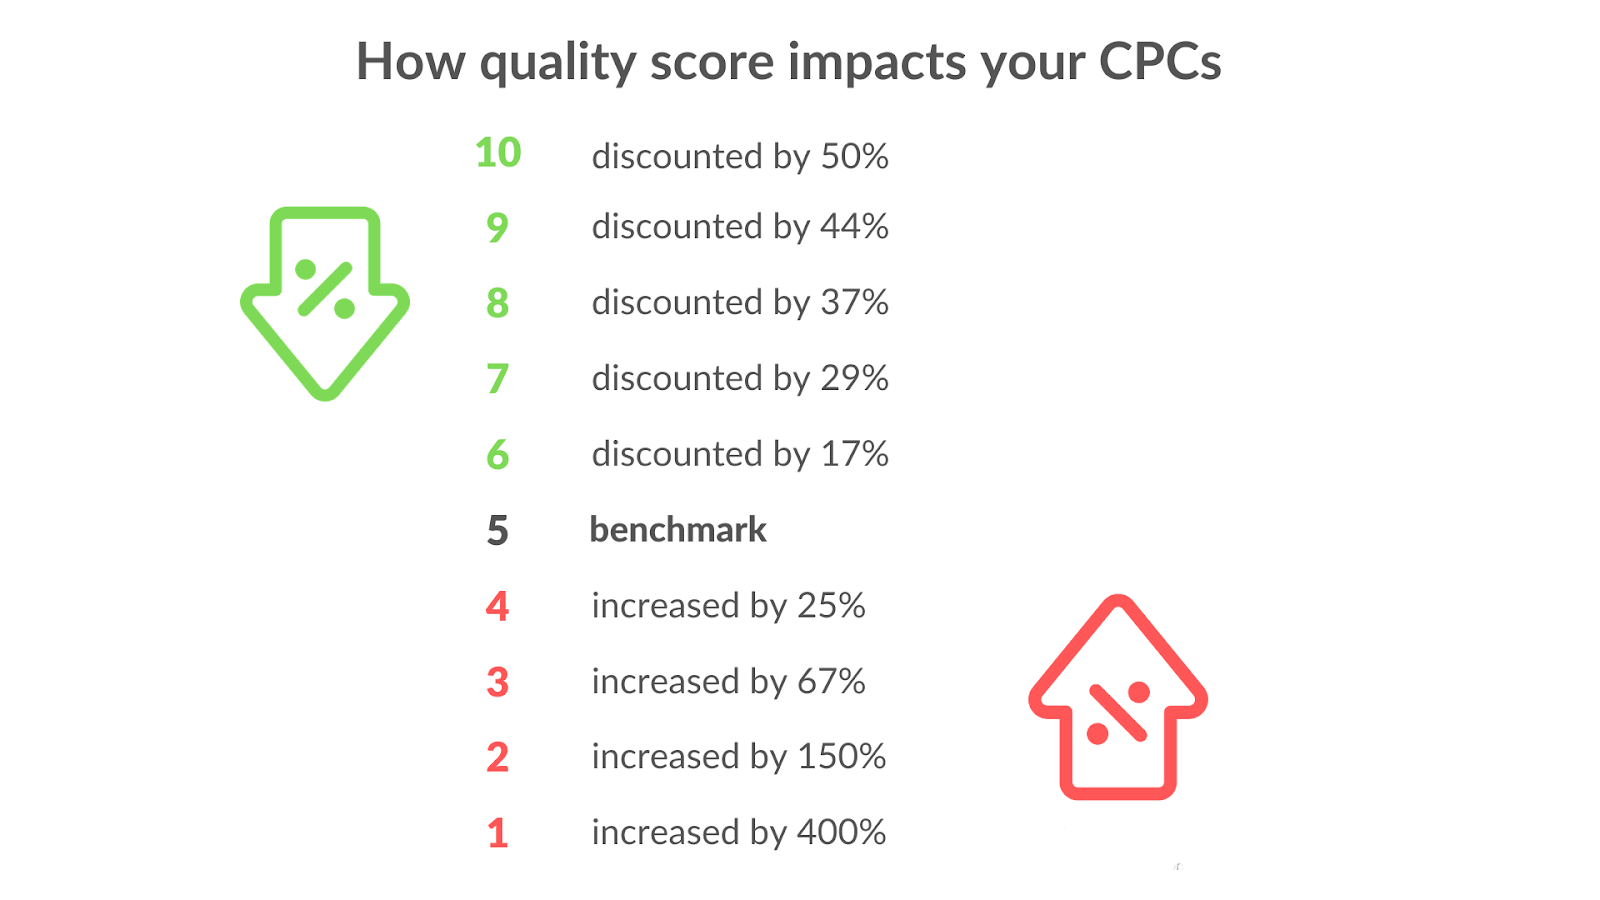
The quality score impact on CPC is significant and well-documented. Store Growers' analysis of the QS formula shows a concrete example: a keyword with QS 5 priced at $1 CPC — improving that score meaningfully can reduce the effective CPC to $0.625, a 37% discount on the same placement. For high-volume campaigns in competitive verticals, LeadGen Economy calculated that a 2-point QS improvement on legal keywords at $40 CPC generates roughly $12,000 in monthly savings at 1,000 clicks. This is how to lower CPC with Quality Score in practice — not by reducing bids, but by earning a lower price through better relevance signals.
What Can Change Fast vs What Takes Time
Not all three components move at the same speed. Ad Relevance can improve quickly — sometimes within days of restructuring ad groups and rewriting ads. Expected CTR is slower because it's based on historical click data, which accumulates gradually. Landing Page Experience can update within a few weeks once Google recrawls the page, but Core Web Vitals improvements and content changes need time to register.
Optmyzr's March 2026 analysis of large accounts — including Zeller Media with 600 campaigns and 4,000 ad groups — found that weekly QS monitoring was the key differentiator: teams that tracked score changes week over week caught drops early and recovered faster than those doing monthly reviews. The implication for anyone looking to increase Google Ads Quality Score fast: fix Ad Relevance first since it moves quickest, then work on landing page, then accept that Expected CTR improvement is a longer game.
Step 1 — Diagnose the Root Cause Before You Change Anything
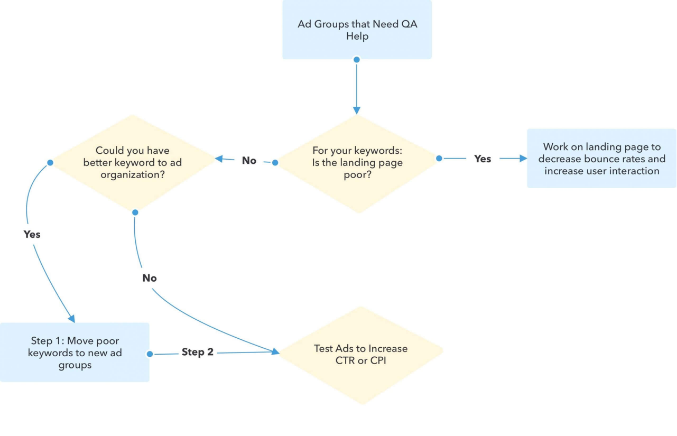
The most common mistake when Quality Score is low: jumping straight to rewriting ads or rebuilding landing pages without knowing which component is actually the problem. A quality score audit Google Ads account starts with reading the three sub-columns before touching anything else.
Pull the Right Views
Start at the keyword level. Sort by Quality Score ascending — the lowest scores first. For every keyword showing "Below average" in any sub-column, note which component is flagged: Expected CTR, Ad Relevance, or Landing Page Experience. This tells you where to focus.
Frederick Vallaeys, co-founder of Optmyzr and former Google engineer, describes Quality Score as a "check engine light" — it tells you something is wrong, but not exactly what. The sub-columns are the diagnostic codes underneath.
Next, pull the search terms report for the same keywords. This is where Quality Score diagnostics expected CTR below average situations usually reveal their real cause — the keyword is matching searches that have nothing to do with the ad, which tanks both CTR and relevance signals simultaneously.
Then check at ad group level. If every keyword in a group is showing "Below average" for Ad Relevance, the problem is structural — the ad group is too broad, not the individual keywords.
Segment Patterns
After the keyword-level audit, segment performance by device, location, time of day, and network. Mobile traffic with a significantly lower CTR than desktop is a common pattern that drags Expected CTR scores down without an obvious cause in the keyword view. Display Network impressions mixed into a Search campaign will do the same — high impression volume with low CTR that poisons the historical CTR data for affected keywords.
This is the full picture needed before starting a Quality Score audit Google Ads fix. Change one variable at a time — otherwise it's impossible to know which fix actually moved the score.
Step 2 — Fix Expected CTR Problems
Expected CTR measures how likely Google thinks someone is to click your ad when it shows for a given keyword — relative to other ads in the same position. "Below average" here almost always means one of two things: the ad doesn't match what the searcher expects to see, or the ad isn't compelling enough to stand out against alternatives.
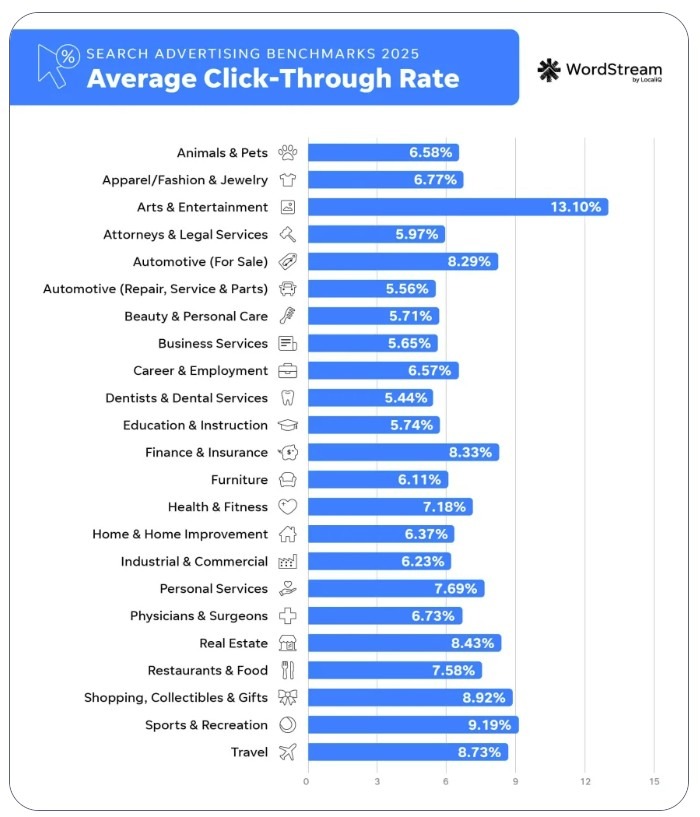
WordStream's 2025 benchmarks put the average CTR across all industries at 6.66%. If a keyword is consistently below that without a structural reason (highly branded, niche B2B, etc.), Expected CTR is worth fixing before anything else.
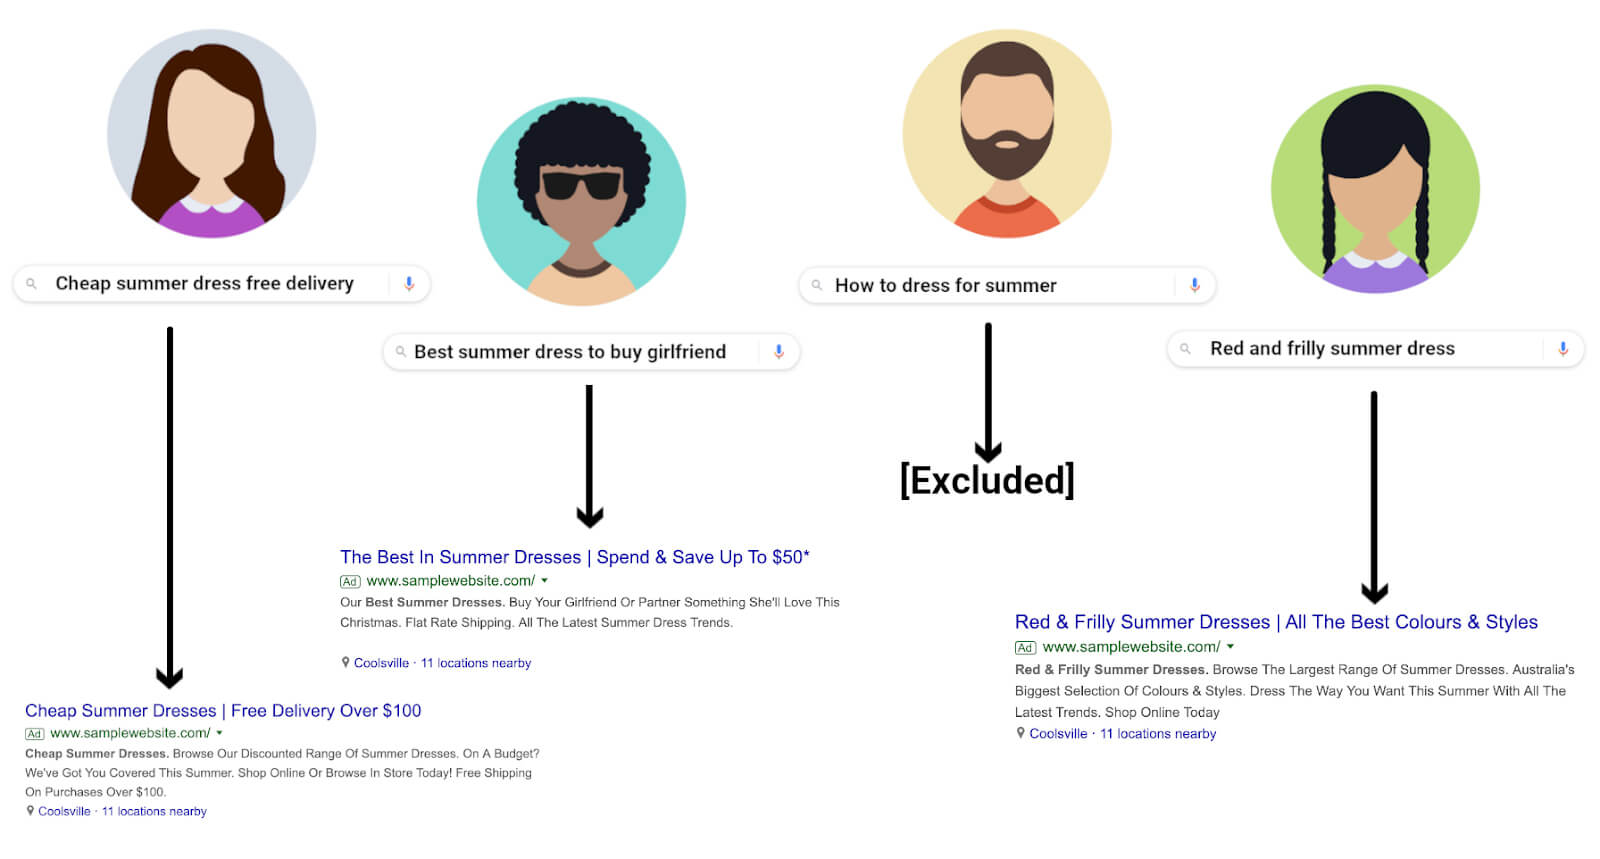
Align Ads to Search Intent and Query Language
The fastest way to improve expected CTR Google Ads is to match the ad's language to what the searcher actually typed. If someone searches "emergency plumber London" and the headline says "Professional Plumbing Services," there's a mismatch — not in topic, but in urgency and specificity. Mirroring the query language in the headline — not keyword stuffing, but genuine relevance — consistently outperforms generic ad copy.
Dynamic keyword insertion ({KeyWord:Default Text}) automates part of this, but it works best for tightly themed ad groups where the inserted keyword actually makes sense in context. In broad ad groups, it often produces awkward headlines that hurt CTR rather than help it.
Write Higher-CTR Responsive Search Ads Without Keyword Stuffing
To improve Quality Score for responsive search ads, the focus should be on headline variety and message clarity rather than repeating the keyword in every asset. Google's asset learning threshold is 500+ impressions per asset and 2,000+ impressions on the full ad over 30 days — below that, performance data isn't meaningful.
A few practical rules for RSA structure: put the strongest value proposition in pinned position 1, leave positions 2 and 3 unpinned to let Google test combinations, and write headlines that make sense in any combination rather than relying on a specific sequence. groas.ai's study of 50+ campaigns found that human-written RSAs consistently outperformed AI-generated ones on conversion rate — the difference was specificity and offer clarity, not volume of copy.
ALM Corp's 2025 creative refresh guidance suggests updating RSAs when CTR drops 25%+ from baseline, or every 4–6 weeks for high-impression campaigns.
Use Assets Strategically
Sitelinks, callouts, and structured snippets don't directly raise Quality Score — but they increase ad real estate, improve CTR, and signal relevance to Google. HUGO BOSS added image assets to mobile campaigns and saw a 5% CTR lift and 2.5x ROAS improvement. Callouts (max 25 characters, non-clickable) work best when they address objections: "Free Returns," "Same-Day Dispatch," "No Setup Fees."
The principle is to use assets to answer the next question a searcher might have after reading the headline — not to repeat the same message in a different format.
Testing Rules
Run at least two RSA variants per ad group. Wait for the asset learning threshold (2,000+ impressions per ad) before drawing conclusions. Pause the weaker variant only when the difference in CTR or conversion rate is statistically meaningful — not after 50 clicks. One change at a time: changing headline, description, and assets simultaneously makes it impossible to know what moved the needle.
Step 3 — Fix Ad Relevance Problems
Ad Relevance measures how closely the keyword, the ad, and the search query align. "Below average" here almost always points to a structural problem — the ad group is trying to cover too many different intents with one set of ads.
Restructure Into Tighter Themes — When SKAG Helps vs Hurts
The debate between SKAGs (Single Keyword Ad Groups) and STAGs (Single Theme Ad Groups) is still active, but the practical answer has shifted. Sitecentre's January 2026 analysis is clear: Google's close variant matching and intent-based query expansion have made pure SKAGs less necessary for most keywords. A STAG with 7–10 closely related keywords and one well-written ad set will outperform a SKAG structure in most accounts because it accumulates data faster and gives Google more flexibility.
SKAGs still make sense for high-value, high-competition keywords where ad copy precision genuinely matters — a $150 CPC legal keyword where every word in the headline counts. For everything else, tighter theme grouping is the practical fix for improve ad relevance Google Ads problems.
Map Keywords to Ads
Every ad in the group should be able to honestly answer every keyword in the group. If it can't — if the ad would feel irrelevant to someone who searched any one of the keywords — the group needs splitting.
The test: take the weakest keyword in the group and ask whether the current headline directly addresses it. If the answer is no, that keyword belongs in its own group with a dedicated ad. This is the core mechanic behind raise Quality Score for exact match keywords — exact match keywords in tightly themed groups with dedicated ads consistently achieve higher Ad Relevance scores than the same keywords in broad mixed groups.
Control Query Matching With Match Types and Negatives
Quality Score and keyword match types have an indirect relationship. Google is explicit: changing match type doesn't directly change Quality Score, which is calculated based on exact search history. But match types control which queries trigger the keyword — and irrelevant queries lower the historical CTR signal that feeds Expected CTR over time.
The practical fix: use exact and phrase match for keywords where Ad Relevance is "Below average," add negatives to block the irrelevant queries showing up in the search terms report, and review match type assignments quarterly. Quality Score improvements checklist for Ad Relevance always starts here — match type cleanup before any creative changes.
Handle Broad Match and Performance Max Spillover Cleanly
Broad match keywords and Performance Max campaigns both expand reach beyond what's explicitly targeted — and both can pull in queries that have nothing to do with the ad, dragging Ad Relevance down across the account.
For broad match, the fix is negative keywords at the campaign or account level. As of March 2025, Google increased the negative keyword limit for PMax campaigns to 10,000 — a 100x increase from the previous limit. This makes it practical to build a proper negative structure for PMax: account-level negatives for brand protection and irrelevant categories, campaign-level negatives for specific query patterns showing up in search term insights. Pulling negatives directly from PMax's search term insights report and applying them weekly is the cleanest way to prevent PMax spillover from contaminating Quality Score signals in parallel Search campaigns.
Step 4 — Fix Landing Page Experience Problems
Landing Page Experience is the component most advertisers underestimate — and the one with the highest ceiling for improvement. Tenscores' analysis found that keywords rated "Above average" for both Landing Page Experience and Ad Relevance see CPCs 36% below account average. That's a bigger discount than most bid optimizations can achieve.
The fix low Quality Score landing page process has four distinct parts.
Message Match — Headline, Hero Section, and Offer Parity
The landing page headline should reflect what the ad promised. If the ad says "Same-Day Plumber — Available Now," the landing page headline shouldn't say "Professional Home Services Since 1998." The searcher made a decision to click based on a specific promise — the page needs to confirm that promise immediately.
This applies to the offer too. If the ad mentions a discount, a free trial, or a specific product, that element needs to be visible above the fold without scrolling. Any gap between what the ad says and what the page shows is a message match failure — and Google's crawlers are looking for exactly this kind of inconsistency when evaluating landing page experience improve Google Ads signals.
Speed and Technical Settings — Core Web Vitals Checklist
Google's official thresholds for Core Web Vitals: LCP (Largest Contentful Paint) under 2.5 seconds, INP (Interaction to Next Paint) under 200ms, CLS (Cumulative Layout Shift) under 0.1. INP replaced FID as a Core Web Vital in March 2024 — accounts still optimizing for FID are measuring the wrong thing.
ALM Corp's analysis of the December 2025 core update found that pages with LCP above 3 seconds lost 23% of organic traffic, and INP above 300ms caused a 31% traffic drop on mobile. Growleads puts the conversion impact in starker terms: every 100ms of additional load time costs 7% in conversions, and 53% of mobile users abandon pages that take more than 3 seconds to load.
The practical checklist: compress images to WebP, eliminate render-blocking scripts, use lazy loading for below-fold content, and test INP specifically on mobile — it's the metric most accounts haven't addressed yet.
Mobile Usability and Form Friction Reduction
More than half of paid search traffic arrives on mobile, and most landing pages are still designed primarily for desktop. The specific friction points that damage Landing Page Experience scores on mobile: tap targets too small, text too small to read without zooming, forms with too many fields, and CTAs positioned below the fold.
Growleads documented a case where moving the primary CTA above the fold produced a 317% conversion rate increase. On form length: reducing fields from four to three has been shown to lift conversion rates by 50% — each additional field is a drop-off point that Google's engagement signals will eventually capture.
Trust Signals — Reviews, Guarantees, Pricing Clarity, Contact Info
Google evaluates landing pages for what it calls "trustworthiness" — the presence of signals that a real, legitimate business is behind the page. The practical elements: visible contact information, customer reviews with specifics (not just star ratings), clear pricing or at minimum a pricing process, and a returns or guarantee policy if relevant.
Pages that lack these signals — particularly in YMYL (Your Money or Your Life) categories like finance, health, and legal — consistently score lower on Landing Page Experience regardless of speed or message match.
Tracking Setup — GA4, GTM, Enhanced Conversions, Consent Mode v2
Proper tracking doesn't directly raise Landing Page Experience scores, but it affects how well Google's algorithm can measure engagement signals from the page — and those signals feed back into QS calculations over time.
Enhanced Conversions are worth implementing regardless of QS — Dataslayer's 2025 analysis documented a 5–25% uplift in measurable conversions after implementation. With 40% of users globally declining cookies, standard conversion tracking misses a significant share of actual conversions, which distorts the data Smart Bidding and QS calculations rely on.
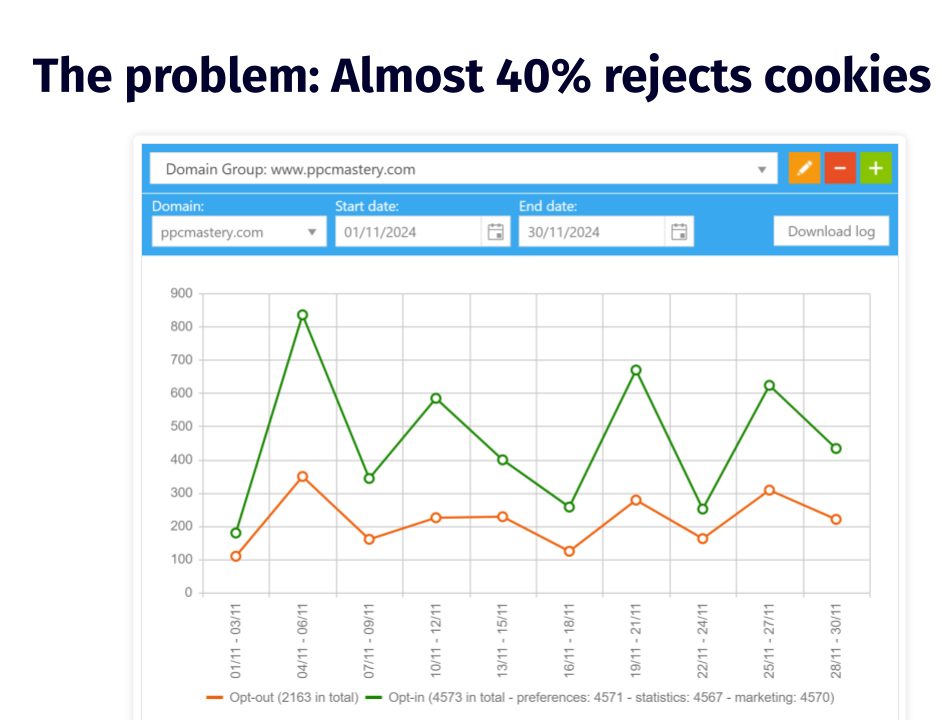
Consent Mode v2's Advanced implementation (not Basic) enables conversion modeling for users who decline consent — Basic mode simply stops tracking those users entirely. For any account running in markets with active cookie consent requirements, Advanced Consent Mode paired with Enhanced Conversions is now the baseline, not an optional upgrade.
Step 5 — Account-Level Levers That Indirectly Improve Quality Signals
Quality Score is calculated at the keyword level, but the signals that feed it are influenced by account-wide settings. These levers don't fix a specific "Below average" component directly — they create conditions where the fixes from Steps 2–4 can take effect faster and hold longer.
Bidding Strategy Interplay — Manual vs Smart Bidding
The question of whether Smart Bidding can improve Quality Score without increasing bids comes up constantly. The honest answer: Smart Bidding doesn't raise Quality Score directly, but it routes impressions toward auctions where the ad is more likely to perform well — which over time produces better CTR signals that feed Expected CTR.
Linear Design's 2025 analysis found Smart Bidding reduces CPA by 10–30% after the ramp-up period, with Loveholidays seeing a 57% profit increase after migration. The important caveat: Smart Bidding performs better when QS is already reasonable. Running Maximize Conversions on a keyword cluster with QS 3/10 and "Below average" Landing Page Experience gives the algorithm bad signals to work with.Fix the underlying QS components first, then layer Smart Bidding on top. Boomcycle documented exactly this sequence: a plumbing company improved QS from 6 to 9 by matching ad copy to service pages and fixing page load times — only then did Smart Bidding produce stable CPA improvements.
Manual CPC still has a role during the diagnostic phase — it gives cleaner data on which keywords are actually performing before the algorithm starts adjusting bids based on partially broken signals.
Targeting — Geo, Ad Schedule, Devices
Targeting settings affect which impressions count toward QS history. A campaign serving globally when the actual converting audience is in three countries accumulates CTR data from users who were never going to click — which dilutes Expected CTR scores over time.
The fix is straightforward: tighten geo targeting to markets with documented conversion history, apply device bid adjustments based on actual CVR by device, and use ad scheduling to concentrate impressions on hours with historically higher engagement. Each of these reduces the volume of low-quality impressions that drag down historical CTR signals without any change to the ads themselves.
Search Terms Hygiene — Negatives, Match Type Cleanup Cadence
This is the maintenance layer that keeps QS improvements from decaying. Brad Geddes, co-founder of Adalysis, noted in Search Engine Land's February 2026 analysis that account structure and search term signals are among the strongest inputs into how Google's AI interprets keyword intent. A clean search terms report — with irrelevant queries excluded before they accumulate impression history — is the foundation everything else is built on.
PPC Hero's Melissa Mackey recommends a quarterly Quality Score audit Google Ads cadence as the minimum: review which keywords have dropped in score, check whether match type assignments still reflect the current keyword strategy, and refresh negative lists at account level for systematic protection. For active campaigns in competitive verticals, monthly is more appropriate.
Troubleshooting Scenarios
Quality Score Stuck at 3/10 or 5/10: The Usual Causes
A Quality Score 3/10 how to fix situation almost always comes down to one of three structural problems: the keyword is too broad for the ad group it's in, the landing page has a message match failure, or the historical CTR data is contaminated by irrelevant query matches that accumulated before negatives were added.
Store Growers' January 2026 analysis puts the cost in concrete terms: QS 3/10 means paying 67% more per click than the neutral benchmark. QS 1/10 means paying 400% more. Fixing a stuck score from 3 to 6 isn't a cosmetic improvement — it's a significant CPC reduction on every click that keyword generates.
Google Ads quality score stuck at exactly 5/10 is a different situation. Five is the neutral point — Google isn't penalising the keyword, but it isn't rewarding it either. The path from 5 to 7 is usually landing page experience: the ad and keyword are fine, but the page isn't converting well enough to signal strong user satisfaction. Frederick Vallaeys of Optmyzr is direct on the target: "Stop trying to get a 10/10. A 7 is a really good score. Even a 6 is fine." For non-brand keywords, 7+ is the practical goal.
New Keywords With No History: What to Do First
New keywords show a dash instead of a QS number — there's no impression history yet. This is the Quality Score for new keywords challenge: the keyword can't be optimised until it has data, but it won't get data until it starts showing.
The practical approach: add the keyword in broad match temporarily to accumulate impressions faster, ensure the ad group already has strong Ad Relevance signals from existing keywords, and make sure the landing page is clean before the keyword starts getting traffic. Google assigns a baseline QS to new keywords based on account history — accounts with generally strong QS get a better starting point than accounts with a history of low scores.
Low Impression Volume and Low Search Volume Status
Keywords marked "Low search volume" are effectively paused by Google — they won't trigger ads until search volume increases. These keywords don't accumulate QS data and shouldn't be the focus of optimisation effort. The fix is either to remove them and find higher-volume alternatives, or to accept that they'll only activate seasonally.
For keywords with impressions but still no QS shown, the threshold is enough exact-match impressions over the trailing 90 days. Broad match variants of the same keyword can help build this history faster.
Brand vs Non-Brand Structure to Prevent Data Dilution
Quality Score for brand vs non-brand keywords should always be managed in separate campaigns. Brand keywords almost always score 9–10 because CTR is naturally high when someone searches your brand name — they already know what they're looking for. Mixing brand and non-brand keywords in the same campaign inflates the apparent account QS without reflecting actual ad quality, and makes it harder to diagnose real problems in non-brand performance.
Adalysis recommends tracking Ad Group Priority Scores — a weighted QS average by impressions and spend — separately for brand and non-brand segments. This gives a cleaner picture of why is my Google Ads Quality Score low in the segments that actually need fixing.
Conclusion
Fixing Google Ads Quality Score is not a one-time task — it's a diagnostic habit. The accounts that maintain strong scores aren't running a different set of campaigns; they're reviewing the three sub-components regularly, catching drops early, and making targeted fixes rather than broad rebuilds.
The sequence matters: diagnose first, fix Ad Relevance and Expected CTR through structural and creative changes, then address Landing Page Experience, then maintain through search terms hygiene and account-level targeting settings. Trying to fix Google Ads Quality Score by increasing bids or switching to Smart Bidding without addressing the underlying components is the most common way to spend more money on the same problem.
A QS of 7+ on core non-brand keywords, clean sub-component ratings, and a weekly review cadence is the practical standard. Everything else follows from that.
FAQ
What is a good Quality Score in Google Ads in 2026?
For non-brand keywords, 7/10 is the practical target. Frederick Vallaeys of Optmyzr puts it plainly: "A 7 is a really good score. Even a 6 is fine." Brand keywords typically score 9–10 by default. The more useful metric is the sub-component breakdown — a keyword at 6/10 with all three components "Average" is in a better position than one at 6/10 with "Below average" on Landing Page Experience.
Why is my Google Ads Quality Score low even with high bids?
Bids don't influence Quality Score. The score is determined by Expected CTR, Ad Relevance, and Landing Page Experience — none of which are affected by how much you bid. Why is my Google Ads Quality Score low despite high spend usually points to a message match problem between the keyword, ad, and landing page.
Why does Quality Score stay the same after I make changes?
Quality Score updates based on accumulated impression data — it doesn't refresh immediately after a change. Ad Relevance can move within days. Expected CTR takes longer because it requires new click data to build. Landing Page Experience updates after Google recrawls the page, which can take one to three weeks.
How long does it take for Quality Score to update?
Ad Relevance: days to a week after structural changes. Landing Page Experience: one to three weeks after page changes. Expected CTR: several weeks to months, depending on impression volume. High-traffic keywords update faster than low-volume ones.
Does Quality Score affect CPC and Ad Rank the same way?
Not exactly. Quality Score impact on CPC works through the Ad Rank formula — a higher QS equivalent lowers the CPC needed to maintain a given position. Ad Rank uses a real-time auction-time quality calculation that's related to but not identical to the 1–10 score. The visible score is a diagnostic snapshot; the auction-time calculation is more granular and context-specific.
Can Smart Bidding improve Quality Score?
Not directly. Smart Bidding optimises bid decisions but doesn't change the three QS components. It can indirectly support QS by routing impressions toward higher-quality auctions, which over time produces better CTR signals. But Smart Bidding on top of a low-QS keyword cluster won't fix the underlying relevance or landing page problems — it will just spend the budget more efficiently on a broken foundation.


