
Best Looker Studio Templates for Google Ads (2026 Guide)
Introduction
If you manage Google Ads campaigns, you already know the pain: the native Google Ads interface gives you data, but not clarity. Numbers scattered across campaigns, ad groups, and keywords — and a client or manager waiting for a clean summary by Friday.
That's exactly why Google Ads Looker Studio templates exist. Instead of building a dashboard from scratch every time, you start with a working structure — metrics already mapped, charts already placed — and just connect your data.
Looker Studio (formerly Google Data Studio) is free, connects directly to Google Ads, and supports real-time data refresh. According to Supermetrics, over 750,000 marketers use their Looker Studio integrations alone — which gives you a sense of how mainstream this reporting approach has become.
This guide covers everything practical: which KPIs to track, how to set up your data connection, what free and paid templates are actually worth using, how to customize reports for clients, and how to handle budget pacing and forecasting. Whether you're a solo PPC manager or an agency running 50 accounts, there's a setup here that fits.
When and why to use Google Ads Looker Studio dashboards
The native Google Ads interface is built for managing campaigns, not for reporting. You can pull numbers, but assembling a coherent picture across campaigns, periods, and accounts takes real effort — especially when you need to share it with someone outside the platform.
A Google Ads Looker Studio dashboard solves this by pulling your data into a visual, shareable report that updates automatically. No exports, no copy-pasting into slides, no manual recalculations. You set it up once, and it stays current.
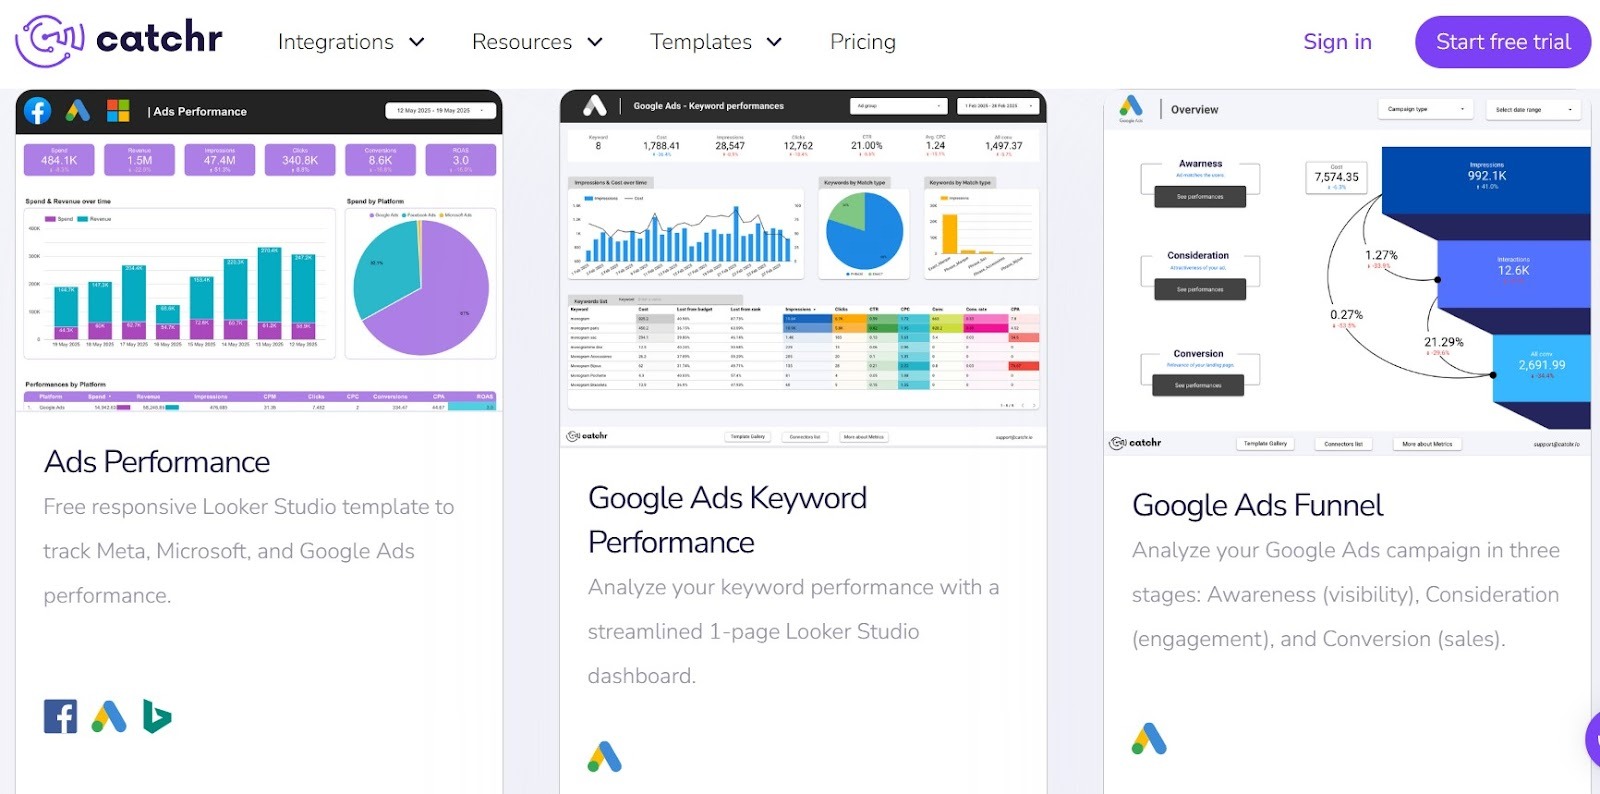
This matters most in three situations: when you report to clients regularly, when you manage multiple accounts, and when you need to compare performance across time periods or channels. Catchr.io, for example, organizes their Google Ads templates specifically around these use cases — SEA performance, lead generation, ecommerce, and PPC overview — because those are the reporting contexts where a static spreadsheet simply stops working.
Metrics and dimensions that matter for PPC
Not every metric in Google Ads deserves a spot on your dashboard. The value of a good Looker Studio PPC reporting template is precisely that it filters the noise — and shows only what drives decisions.
The metrics that consistently appear across well-built templates include impressions, clicks, CTR, CPC, conversions, conversion rate, cost per conversion, and ROAS. Coupler.io's Google Ads dashboard template, for instance, surfaces all of these on the overview page alongside period-over-period comparison — so you see not just where you are, but whether you're moving in the right direction.
Dimensions matter just as much. Campaign name and type let you slice performance by structure. Device breakdown shows where your budget actually converts. Keyword-level data reveals which search terms are pulling weight and which are draining spend. Demographics add another layer for accounts where audience targeting plays a role.
The combination of the right metrics and the right dimensions is what turns a dashboard into something you can actually act on — rather than just look at.
Key KPIs to track in Google Ads Looker Studio
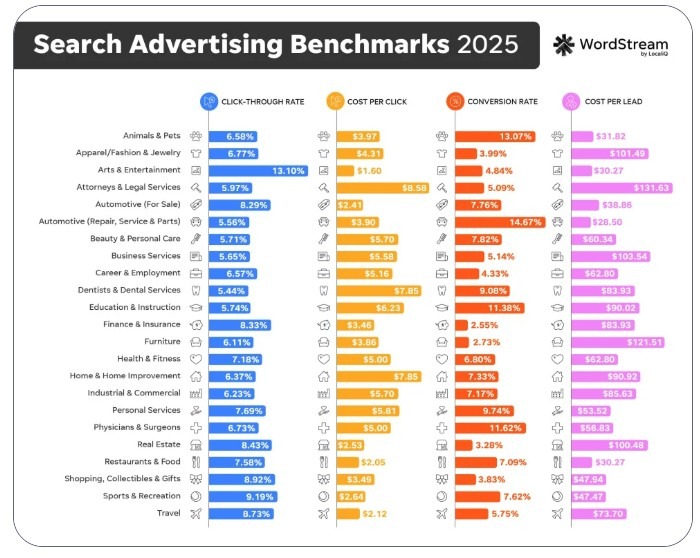
A dashboard without the right KPIs is just decoration. The goal is to show metrics that drive decisions — not every number Google Ads can export. According to WordStream/LocaliQ's 2025 benchmark report based on 16,000+ campaigns across 23 industries, average CPL across all industries reached $70.11, up 5.13% year over year. That kind of shift is easy to miss if you're not tracking it in a structured Google Ads KPI dashboard Looker Studio report updated regularly.
A practical way to structure KPIs is by audience. An executive wants ROAS, CPA, and total conversions. A campaign manager needs CTR, Quality Score, and impression share. A monthly review calls for year-over-year trends, device splits, and geo breakdowns. Building your dashboard around these three layers keeps it useful for everyone who opens it.
Efficiency metrics: CPC, CPA, ROAS
These three tell you whether your money is working. According to the same WordStream/LocaliQ 2025 data, average CPC across all industries is $5.26 — up 12.88% year over year, with 87% of industries seeing increases. Kelsie Mixon, Customer Success Manager at LocaliQ, puts it directly: "It's important that we're constantly checking on the campaigns to make sure our bids are appropriate for each keyword. If our CPC is too high, we won't be able to prove a valuable return on investment."
CPA cuts deeper than CPC. If you're paying $70 to acquire a lead worth $500, the math works. If that number quietly climbs to $200 without anyone noticing, you have a problem. ROAS sits alongside CPA as the metric most clients anchor their decisions to — which is why a solid Google Ads performance dashboard template puts it front and center, not buried in a table on page three.
Volume metrics: impressions, clicks, CTR
Volume metrics show the health of your reach. The 2025 WordStream/LocaliQ benchmark puts average CTR across all industries at 6.66% — a significant jump from 1.35% when they first collected this data in 2015. Amy Bishop, owner of PPC agency Cultivative Marketing, frames CTR's role well: "CPC and CTR are health metrics. They're important to keep a pulse on and to use as levers to achieve your goals. However, they aren't KPIs. Focusing too much on CPCs or CTR as a KPI can be detrimental."
In a Google Ads performance overview report, impressions and clicks work best as context for efficiency metrics — not as standalone success indicators. A sudden drop in impressions often signals a budget cap, a policy issue, or a Quality Score problem worth investigating immediately.
Revenue and lead quality metrics
Clicks and conversions only tell part of the story. For lead generation accounts, conversion volume means little without lead quality data. Brett McHale, Founder of Empiric Marketing, makes this point clearly: "The cost per lead and that lead's conversion rate down the sales funnel is what is most important to my clients who are running search advertising to get leads."
For ecommerce, revenue per click and average order value sit alongside ROAS to give a fuller picture. Katia Hausman, VP of Product at LocaliQ, adds an important nuance: "It's acceptable for CPC to rise if CPL is falling and conversion rates are improving. Therefore, it's important to invest in tools that allow you to understand the true value of your leads to get a complete picture of performance." A well-built Google Ads conversion tracking report makes this comparison visible at a glance — without digging through multiple campaign views.
Types of Google Ads Looker Studio templates
Not all Google Ads Looker Studio templates are built the same — and the free vs. paid distinction isn't just about price. It's about depth, flexibility, and how much time you want to spend setting things up versus actually analyzing data.
Free templates for Google Ads Looker Studio
Free Google Ads report templates cover the essentials well. They typically include campaign overview, impressions, clicks, CTR, conversions, and basic date filtering. For a solo PPC manager or a small team reporting on a handful of accounts, they're often all you need.
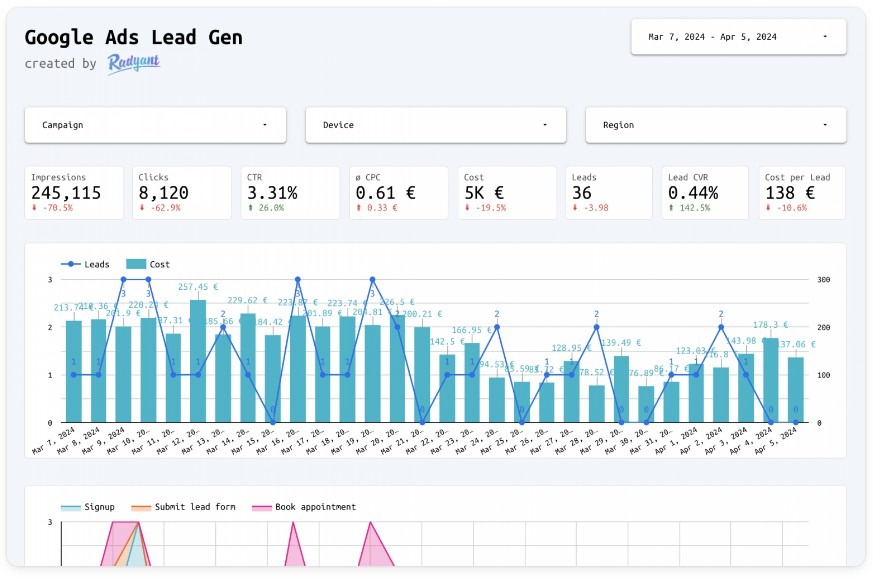
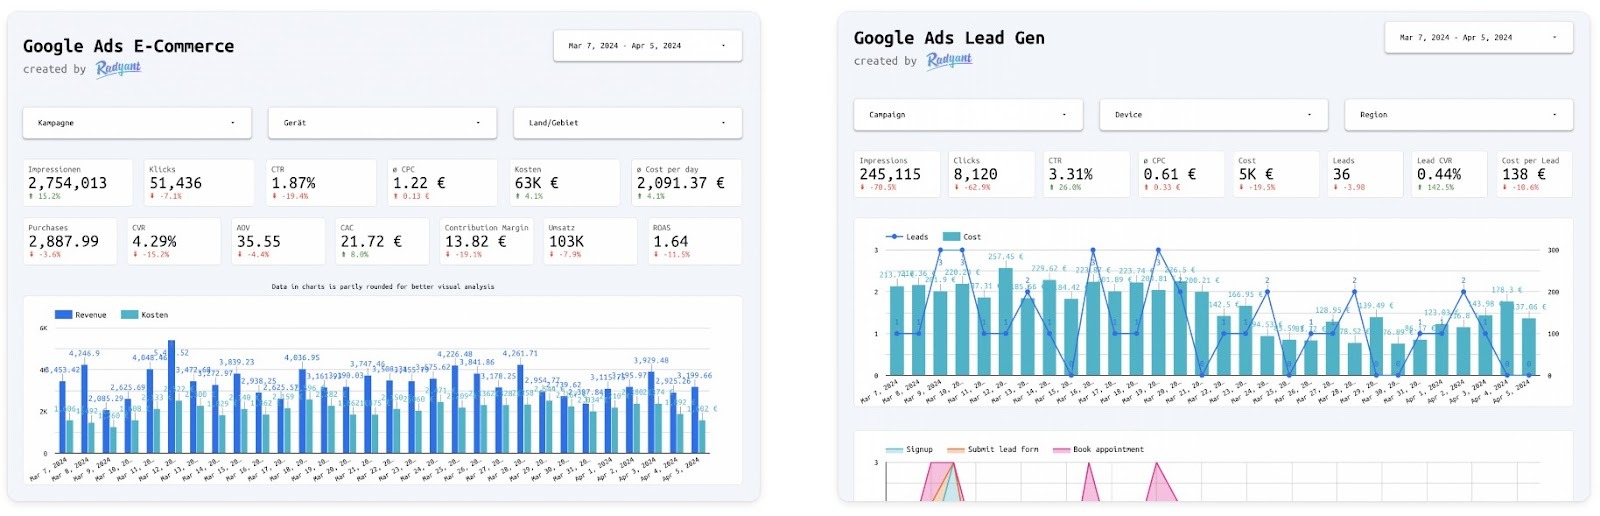
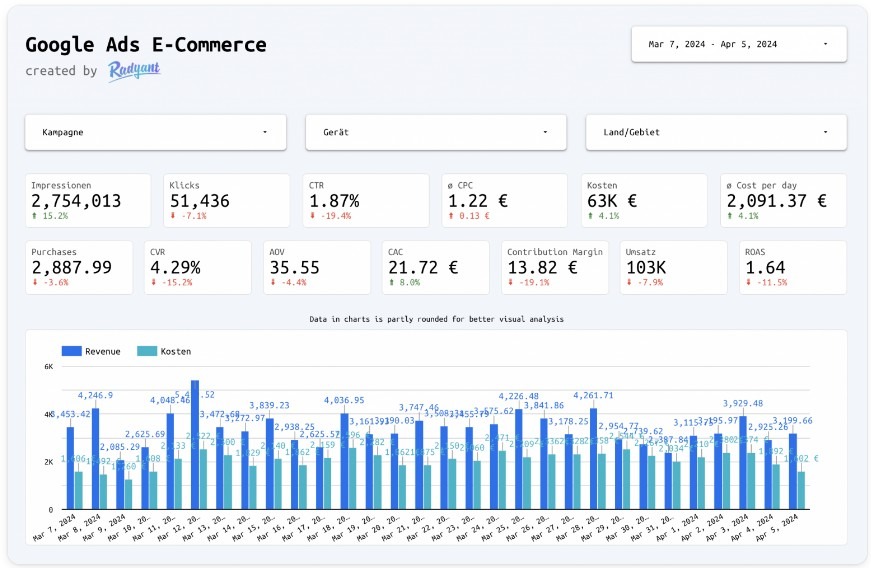
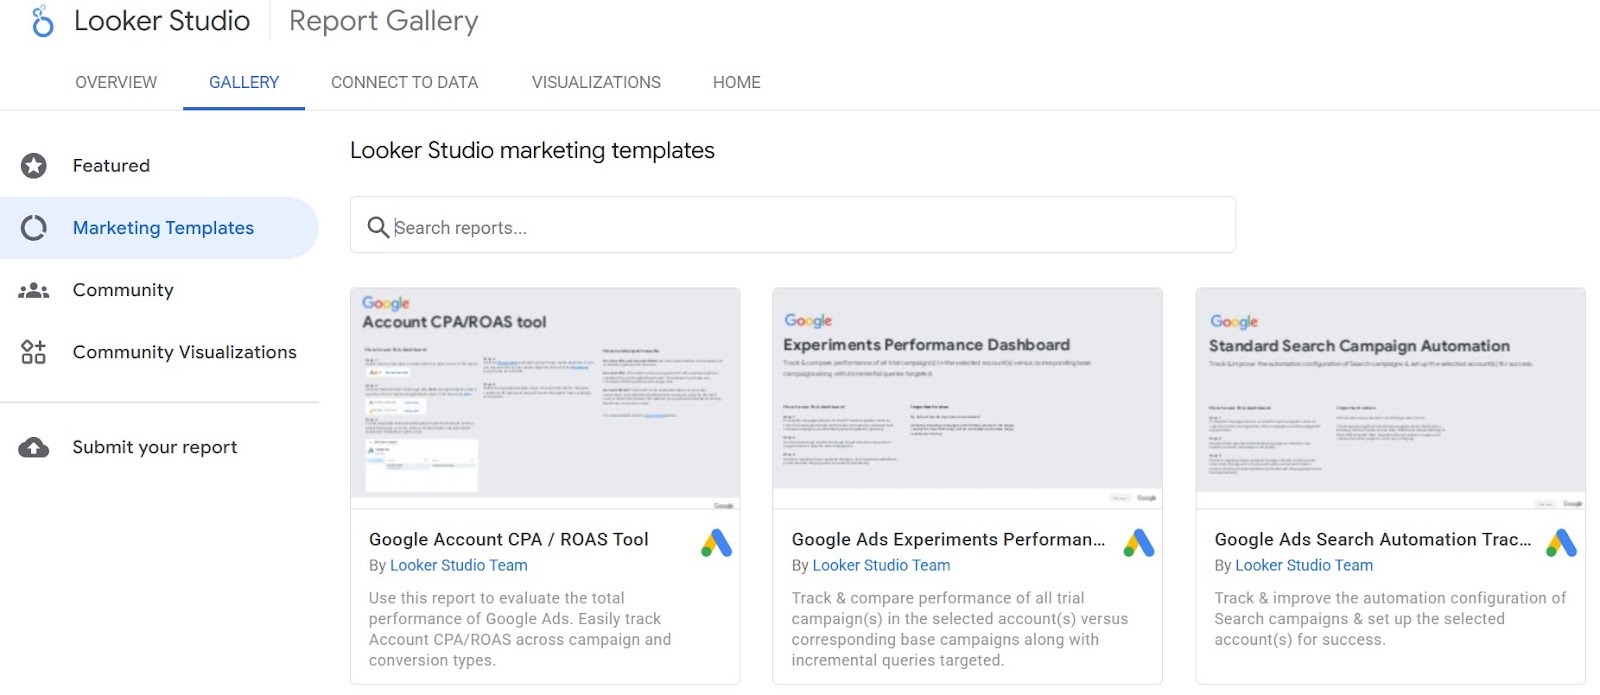
Radyant offers three free Google Ads Looker Studio templates — Ecommerce, Lead Generation, and Lead Gen with Offline Conversion Tracking — used by over 4,500 Google Ads specialists. Coupler.io provides 16 free templates including a Google Ads vs. other channels report, keyword performance, leads dashboard, and Quality Score analytics, all with automatic data refresh. Google itself publishes a campaign performance dashboard directly in the Looker Studio template gallery, which requires no third-party connector.
The main limitation of free templates is depth. They show you what's happening, but rarely help you understand why — keyword-level filtering, year-over-year comparisons, and day/time breakdowns are usually locked behind paid tiers.
Paid templates for Google Ads Looker Studio
Paid templates make the most sense when you're managing multiple client accounts, need white-label branding, or want advanced segmentation out of the box. The time saved on setup alone tends to justify the cost.
Data Bloo's Essential Google Ads template spans 20 pages and covers campaign type breakdowns, keyword performance, landing page analysis, location and audience data — and it's featured by Google in the official Looker Studio gallery. Radyant's Pro Dashboards Bundle, currently available at $149, adds cross-filtering between keywords and search queries, YoY insights, and day/time performance breakdowns that free versions don't include. For agencies sending weekly reports to clients, a paid Google Ads client reporting template with built-in commentary sections and rebrand placeholders removes hours of manual work per month.
Setting up Google Ads data in Looker Studio
Getting your data into Looker Studio is straightforward — but the choices you make at setup stage affect everything downstream: data freshness, multi-account reporting, and how reliably your dashboard holds up over time.
Connecting Google Ads accounts and MCC
The native Google Ads connector is free and built directly into Looker Studio. Setup takes 5–10 minutes for a basic connection: open Looker Studio, create a new data source, select the Google Ads connector, authorize your account, and choose your report type — Campaign, Keywords, Ads, or Geo. For most general dashboards, Campaign Performance is the right starting point.
For agencies running a Google Ads multi account report, the MCC connector is the practical choice. According to Google's official documentation, a single MCC data source can connect to up to 50 sub-accounts — which means one data source covers most mid-size agency portfolios without any blending workarounds. One important note: if your MCC accounts use different currencies, Looker Studio converts all revenue fields to the top-level MCC currency. For international portfolios, this is worth factoring in before you build cost-related charts. For agencies needing a ready-made Google Ads MCC dashboard template, starting with an MCC-level data source is the prerequisite — it unlocks multi-account visibility in a single report
Choosing connectors and managing data sources
The native connector works well for single-account Google Ads campaign reporting dashboards, but has real limitations at scale. Background data refresh is only available in Looker Studio Pro ($10/month), and even then it's capped at fixed intervals — often every 12 hours. There's also no native cross-channel data unification: Google Ads data doesn't automatically blend with Meta, LinkedIn, or HubSpot without manual setup or a third-party tool.
For agencies or teams managing multiple clients, third-party connectors like Catchr, Supermetrics ($47/month), or Windsor.ai remove the manual overhead. Catchr, for example, lets you connect multiple accounts into a single data source without data blending — which keeps the report cleaner and reduces the risk of metric mismatches. Windsor.ai supports over 2,000 Google Ads metrics and dimensions and refreshes data on a custom schedule, from every 15 minutes to daily. According to Swydo's 2026 connector guide, the native Google Ads connector added new "Platform Comparable" metrics in November 2025 — useful for cross channel PPC dashboard Looker Studio setups without a paid connector.
Structuring data for reliable metrics
How you structure your data source determines whether your dashboard stays reliable as the account scales. A few things that consistently cause problems: mixing dimensions and metrics that can't be combined (Looker Studio will show a chart error rather than just blank data), using date ranges with no activity, and pulling creative asset data without including Ad Type and Asset ID dimensions alongside clicks or impressions — which Google's own documentation flags as a source of inaccurate results.
One change worth knowing: as of September 23, 2024, Auction Insights data was permanently removed from all Looker Studio reports regardless of connector. If your existing Google Ads agency dashboard Looker Studio setup included Auction Insights fields, those charts will have broken — and need to be rebuilt using alternative competitive metrics.
Customizing your Google Ads Looker Studio template
A template out of the box gets you 70% of the way there. The remaining 30% — the part that makes a dashboard actually useful for your specific account or client — comes from customization. The good news is that Looker Studio's editor is fully visual and doesn't require any coding.
Editing charts, filters and date controls
The first things worth adjusting in any Google Ads Looker Studio template are date controls and filters. Setting the default date range to "Last 30 days" with a comparison to "Previous 30 days" gives anyone who opens the report immediate context — they see not just current numbers, but whether things are moving in the right direction. Most templates don't set this by default.
For filters, campaign type and campaign name dropdowns are the minimum. Adding a device filter and a network filter (Search vs. Display vs. Shopping) lets a campaign manager slice data without requesting a new view. Interactive controls make a Google Ads report template far more useful than a static PDF — stakeholders can explore the data themselves instead of emailing back with follow-up questions.
Building segments for audience and device insights
Device and audience breakdowns are where a lot of accounts hide their biggest inefficiencies. A campaign might look healthy at the top level while mobile traffic converts at 0.8% and desktop at 4.2% — a gap that's invisible without device segmentation. The same logic applies to audiences: if your remarketing segment has a significantly higher ROAS than cold traffic, that's a budget allocation decision, not just a reporting footnote.
Data Bloo's Essential Google Ads template, featured by Google in the official Looker Studio gallery, covers exactly this — with dedicated pages for audience segments, device performance, Google Ads keyword performance dashboard, and location data across its 20-page structure.
Styling white label dashboards for clients
For agencies, the visual layer of a dashboard matters as much as the data layer. According to AgencyAnalytics' 2024 Marketing Agency Benchmarks Report (251 agencies surveyed), 77% of agencies manage PPC campaigns for clients — and 92% of top-volume agencies have uploaded their own logo to their reporting platform, compared to only 71% of smaller boutique operations. That gap reflects how seriously larger agencies take branded reporting as a retention tool.
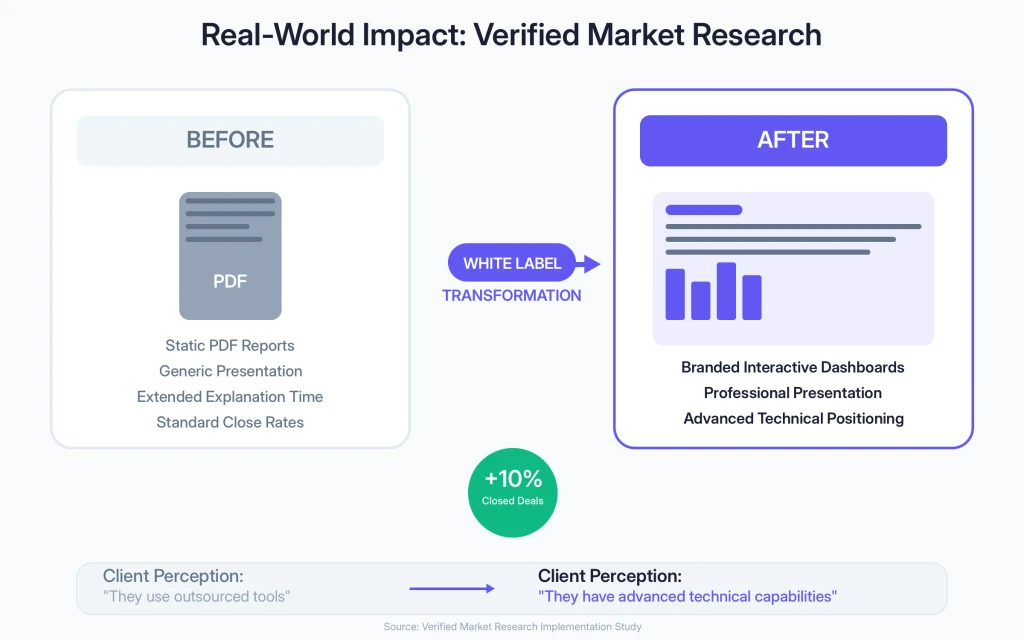
The business case is clear: according to Wayfront's 2025 white-label reporting analysis, agencies that switch to branded, transparent dashboards see client churn drop by up to 50%. Verified Market Research, a consulting company cited in the same report, transitioned from static PDFs to branded interactive dashboards and saw a 10% increase in closed deals within months — while cutting the time spent explaining reports in half.
Full white-label customization in Looker Studio means replacing the logo, applying brand colors through Theme settings, updating font styles, and removing any provider references. When reports carry visible branding from third-party tools, clients may start questioning whether they could cut costs by going direct. A properly branded Google Ads client reporting template keeps the focus on your agency's expertise — not the tool behind it.
Budget, pacing and forecast reporting
Knowing how much you've spent is easy. Knowing whether you're on track to hit your monthly targets — and catching problems before the month ends — is where most Google Ads accounts fall short. A dedicated Google Ads budget tracking dashboard in Looker Studio fills this gap by combining actual spend data with targets set externally.
Monthly budget versus spend dashboards
The core challenge with budget pacing is that Google Ads doesn't natively let you set custom monthly targets and compare them to actual spend in a visual, shareable format. As Amy Hebdon, founder of Paid Search Magic, explains in her Search Engine Journal guide: "We still can't add goals and targets to the Google Ads platform, so we still need separate dashboards to track pacing and progress."
The standard workaround: blend Google Ads data with a Google Sheets file where you manually enter monthly targets. Looker Studio then uses both sources to calculate pacing in real time. Hebdon offers two free versions of this setup — one for ecommerce accounts (Revenue as KPI) and one for lead generation (Conversions as KPI). One critical detail: the account name in Google Sheets must match exactly with the Google Ads account name, because it functions as the blended data join key. A single character difference breaks the entire connection.
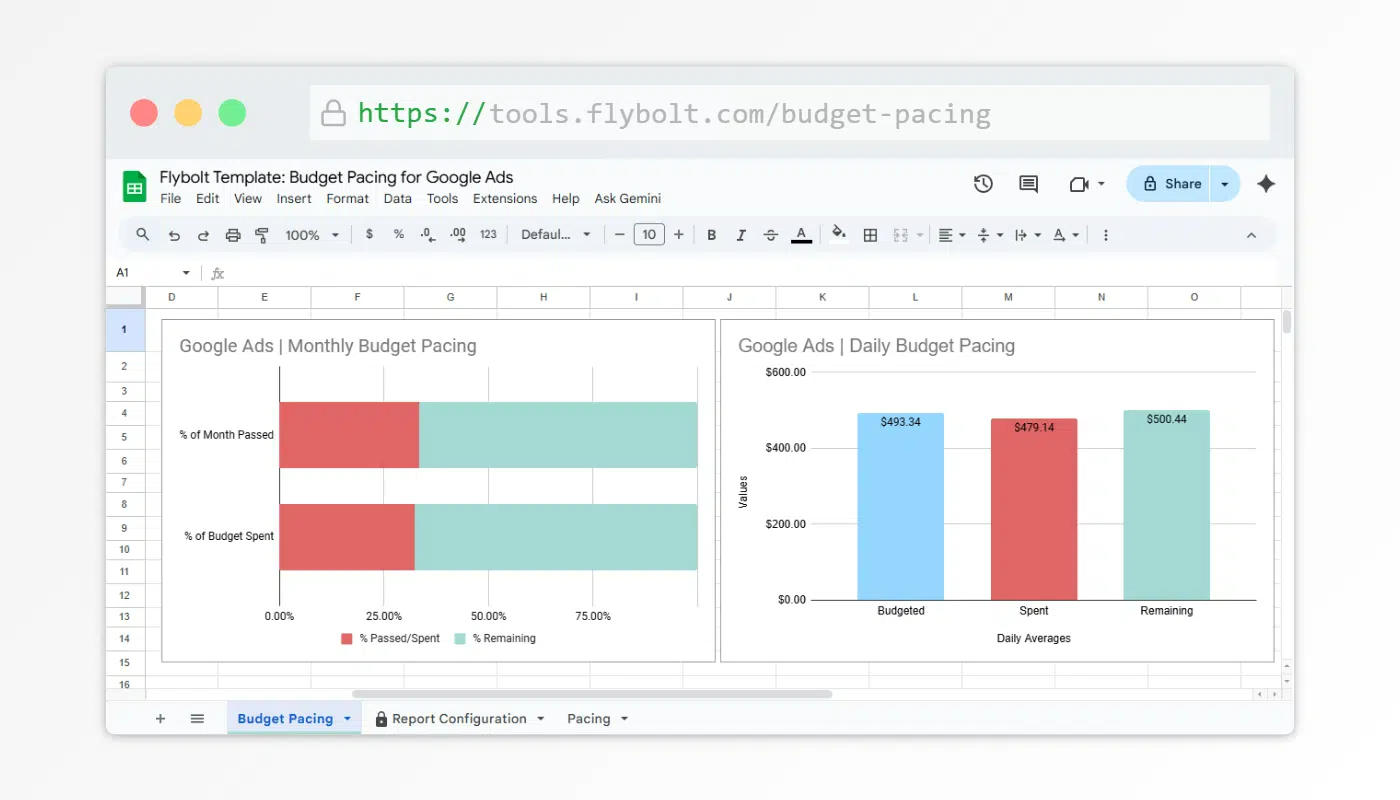
Flybolt frames budget pacing well: "Think of it like a fuel gauge for your campaigns. You're not just watching how fast you're going; you're making sure you'll reach the finish line without running out of gas or flooding the engine."
Detecting wasted spend and underperforming campaigns
A Google Ads monthly performance dashboard that only shows top-line numbers hides where money is quietly leaking. The most practical waste-detection view is a simple table filtered to show keywords where conversions equal zero and cost exceeds a set threshold — sorted by cost descending. That becomes a direct action list: keywords to pause, ad groups to restructure, or budgets to reallocate.
Campaigns can ramp up quickly, fluctuate with demand, or overspend earlier in the month — especially when budgets are shared or bidding strategies change. Catchr's dedicated Google Ads Budget template addresses this with a single-page view designed specifically for budget monitoring, showing spend pacing against targets without requiring a multi-page report structure.
Simple forecasting views for decision makers
Forecasting in Looker Studio doesn't need to be complex. The most practical approach is a simple projection: take month-to-date spend, divide by days elapsed, multiply by total days in the month. That single number — projected monthly spend — tells a decision maker whether to scale, hold, or pull back before it's too late.
For accounts with consistent spend patterns, this projection is reliable enough to surface in a client-facing report without additional modeling. The goal, as Hebdon puts it, is for the dashboard to give "instant access to performance goals and actuals" — making it possible to act as a more strategic paid search marketer rather than spending time chasing numbers across platforms.
Quality assurance and troubleshooting
A dashboard that shows wrong numbers is worse than no dashboard at all. A misread metric can lead to pausing profitable campaigns, scaling underperformers, or presenting incorrect data to a client. QA isn't optional — it's part of the setup process.
Validating data between Google Ads and Looker Studio
The most common shock for first-time users: numbers in Looker Studio don't match what Google Ads shows. Conversion totals differ. Revenue figures look off. The root causes are almost always the same: mismatched date ranges, timezone differences, broken credentials, or incompatible dimension-metric combinations.
Google's own documentation flags one specific issue worth knowing: when using Clicks or Impressions metrics alongside creative asset dimensions, you must also include Ad Type and Asset ID in the chart. Without these two fields, the data will be inaccurate — and the chart will display a warning rather than silently showing wrong numbers. Entities with zero impressions (ad groups or campaigns that haven't served) also won't appear in Google Ads data sources at all, which can make reach look smaller than expected.
The validation fix is straightforward: cross-check three key metrics — spend, clicks, and conversions — against the native Google Ads interface using identical date ranges and filters. If those three align, the rest of the dashboard is almost always correct.
Common connector, date and attribution issues
One change that broke many live dashboards: as of August 24, 2024, Auction Insights fields stopped being available for new Looker Studio data sources. On September 23, 2024, existing data sources lost access entirely. According to Google's official documentation, this applies regardless of which connector is used — native Google Ads, BigQuery, or Google Sheets. Any dashboard that included Auction Insights fields after that date will have broken charts that need to be rebuilt using alternative competitive metrics.
On the date comparison side, Swydo's agency guide flags a subtle but impactful issue: Looker Studio's default year-over-year comparison matches the same calendar dates, not the same weekdays. For accounts where performance varies significantly by day of the week, comparing this year's Thursday numbers to last year's Wednesday numbers produces misleading data. The fix requires custom calculated fields rather than relying on the default comparison control.
Attribution is another common source of discrepancy. Google Ads defaults to a 30-day click attribution window, while GA4 may use a different model for the same conversion events. When blending both sources in the same dashboard, these differences will surface as gaps in reported conversion numbers — and need to be documented clearly so clients don't interpret them as tracking errors.
Maintenance checklist for live dashboards
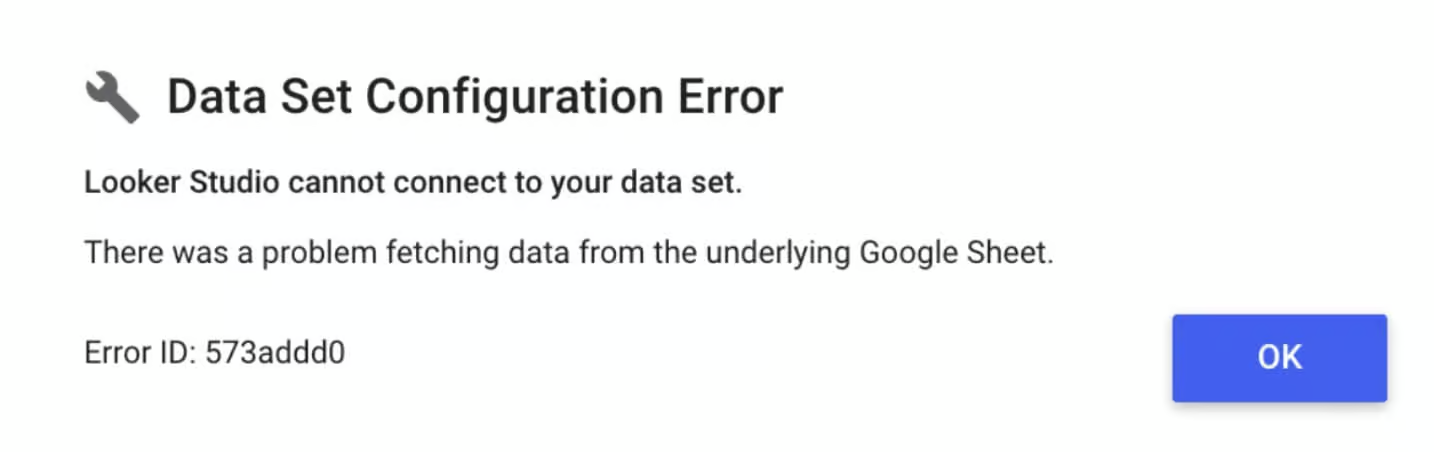
Live dashboards degrade over time without maintenance. Connector authentication expires periodically and requires re-authorization — if a client opens a report and sees "No Data," expired credentials are the first thing to check. As Swydo notes in their agency setup guide, testing the connector with real client accounts before going live is essential, since per-account fees and refresh rate limits can create unexpected gaps in data as account volume grows.
A practical monthly checklist: re-authorize data source credentials, cross-check spend, clicks, and conversions against the native interface, verify that date range controls are still set to intended defaults, and confirm that any blended Google Sheets files — such as budget pacing targets — still have matching join keys. These checks take under 15 minutes and prevent the kind of reporting failures that quietly erode client trust.
Example workflows and templates for key use cases
A generic Google Ads dashboard works for a quick overview. But the moment you need to make a real decision — pause a campaign, shift budget, justify spend to a client — you need a setup built around your specific context. Lead gen and ecommerce ask fundamentally different questions from the same data.
Lead generation accounts
For lead gen, the core reporting question isn't "how many clicks did we get?" — it's "how many qualified leads, at what cost, and which campaigns are delivering them?" Volume metrics can look healthy while the account bleeds budget on low-quality traffic. This is precisely the problem a structured Google Ads lead generation report is designed to surface.
Grow & Convert, a content and paid search agency, documented exactly this with an ecommerce development agency client. The previous agency's numbers looked fine on the surface: 26 leads over three months, average CTR of 6.25%, ~55k impressions, CPL ~$1,077. The problem was quality: after filtering out junk leads, only 2 of those 26 were actual MQLs — at a cost of ~$14,000 each. After restructuring the account and, critically, disabling Google Search Partners, MQL rate jumped from 7.6% to 24%, cost per MQL dropped from ~$14,000 to ~$3,400, and monthly ad spend actually fell from ~$9k to ~$7k. None of that analysis was possible without tracking MQL conversion rates by traffic source — not just raw leads.
Llama Lead Gen's work with CodeSignal tells a similar story at scale. Running across Search, Display, Video, and Performance Max, their campaign generated over 35 million impressions and drove CPL down 46% year over year — from $272.85 in 2022 to $148.13 in 2023 — while increasing MQLs by over 50% within the first 9 months. CodeSignal noted directly: "Llama Lead Gen improved the tracking of our digital ad spending and results. This provided further insight into the effectiveness of our campaigns."
For agencies presenting these results to clients, Catchr's Google Ads funnel report template structures this data across three stages — Awareness, Consideration, and Conversion — making the pipeline story readable for stakeholders who aren't deep in PPC metrics.
Ecommerce and retail campaigns
Ecommerce reporting centers on revenue, ROAS, and the full path from click to purchase. The challenge is that ROAS at the account level can mask serious problems at the campaign or product level — which is exactly what a well-structured Google Ads ecommerce dashboard template is designed to expose.
Kaity Griffin's agency worked with an online florist that came to them in July 2024 losing money during its two biggest sales periods — Valentine's Day and Mother's Day — despite heavy Google Ads investment. After fixing account structure with segmented Performance Max campaigns by product performance, and supporting them with a non-brand search campaign built around converting search terms, the results were clear. Valentine's Day 2025 vs 2024: cost down 4% ($60.5k → $58.5k), revenue up 97% ($294k → $580k), ROAS jumping from 486% to 993%. Mother's Day 2025 vs 2024: cost down 25% ($68.6k → $51k), revenue up 77% ($252k → $446k), ROAS from 368% to 871%.
The reporting structure that made those decisions possible tracks ROAS by campaign type and product segment — not just account-wide averages. For retail accounts running Search, Shopping, and Performance Max simultaneously, Data Bloo's Essential template handles this with dedicated pages per campaign type, so Shopping ROAS and Search CPA don't get averaged into a number that obscures where performance is actually coming from.
Conclusion
Google Ads reporting has never been more consequential. With CPCs rising 12.88% year over year in 2025 according to WordStream/LocaliQ benchmarks, and Google continuing to push deeper into AI-driven automation, having a clear and reliable view of what's actually working is no longer optional — it's a competitive advantage.
The challenge, as Ameet Khabra, founder of Hop Skip Media and one of the Top 50 Most Influential PPC Experts, puts it: "Many believe automation failed us, but I believe it's the other way around. The automation didn't fail us; we failed the automation. We did not provide it with clean data." A well-structured Google Ads Looker Studio template is part of fixing that — it keeps your data readable, your conversion signals clean, and your decisions faster.
Google rolled out significant reporting improvements in 2025: Performance Max channel reporting, AI Max for Search, and expanded controls that finally let advertisers see where their budget actually goes across Search, YouTube, Display, and Discover. Reva Minkoff, founder of Digital4Startups, captured the direction well at the Search Engine Land SMX Next 2025 panel: "It's still important to have a good search campaign with keywords that you control and ads you create — if you're not putting good stuff in, you won't get good stuff out." Khabra added that anomaly detection through scripts and dashboards is now essential: "We'll have scripts in place that are like anomaly detectors, just so we know that tracking is off."
Looker Studio templates for Google Ads give you the infrastructure to act on all of this. Free options from Coupler.io, Radyant, and Google's own gallery cover most use cases out of the box. Paid templates from Data Bloo and others add the depth agencies need for client-facing reporting. The tools are there — the work is in using them consistently.
FAQ
What is a Google Ads Looker Studio template?
A Google Ads Looker Studio template is a pre-built dashboard that connects directly to your Google Ads account and visualizes campaign performance data automatically. Instead of building charts and metrics from scratch, you copy a template, connect your data source, and get a working report in minutes. Templates typically include impressions, clicks, CTR, CPC, conversions, and ROAS, organized across one or more pages with filters and date controls already in place. Searching for a Google Ads report template, Looker Studio is the fastest way to find a working structure without building from scratch.
How do I connect Google Ads to a Looker Studio dashboard?
Open Looker Studio, create a new report, and select the Google Ads connector from the data source list. Authorize access with a Google account that has at least Standard access to your Google Ads account. For agencies managing multiple accounts, connecting at the MCC level gives access to up to 50 sub-accounts from a single data source. Basic setup takes 5–10 minutes. For multi-account or cross-channel reporting, third-party connectors like Catchr or Supermetrics add more flexibility. Note that as of September 2024, Auction Insights fields are no longer available in any Looker Studio connector.
Which KPIs should I track in a Google Ads Looker Studio report?
The essential KPIs depend on your account type. For all accounts: CPC, CPL or CPA, ROAS, CTR, and conversion rate. For ecommerce: add revenue, average order value, and ROAS by campaign type. For lead gen: add cost per lead, leads by campaign, and — if available — offline conversion data to track lead quality beyond raw form fills. Device breakdown and campaign-level segmentation should be in every report regardless of account type. According to WordStream/LocaliQ 2025 benchmarks, the average CPL across all industries is $70.11 — useful as a baseline when evaluating your own account performance.
Are Google Ads Looker Studio templates really free to use?
Many are. Coupler.io offers 16 free Google Ads Looker Studio templates, Google provides its own campaign dashboard in the Looker Studio template gallery, and Radyant offers free templates for e-commerce and lead gen use cases. Free versions cover essential metrics well. Paid templates — such as Data Bloo's Essential template, featured by Google in the official gallery — add deeper segmentation, multi-page structures, and white-label options that make more sense for agencies or accounts with complex reporting needs.
How can agencies customize Google Ads templates for clients?
Looker Studio supports full white-label customization: replace logos, apply brand colors through Theme settings, update fonts, and remove provider references. Adding a client-specific data control lets you reuse one template across multiple accounts without rebuilding the report each time. According to AgencyAnalytics' 2024 benchmarks report, 92% of top-volume agencies have uploaded their own logo to their reporting platform — compared to 71% of smaller agencies — reflecting how seriously larger operations treat branded reporting as a client retention tool.


